Pulling Stock Data with Alpha Vantage API
Pulling Stock Data with Alpha Vantage API
Introduction
In the last post we talk about basic details about Alpha Vantage platform. now we will see how we can pull Historical stock data using Alpha Vantage API.
Alpha Vantage is a great place for collecting Stock Market data Such as Intraday, daily data, Fundamental Data, Indicator data etc. In this tutorial we will show you basic Code to fetch Stock daily data using Alpha Vantage API.
What will you require?
- Alpha Vantage demo API click here to claim demo API.
- Python install in your system.
Methodology
First, we import necessary library to connect with API.
import pandas as pd
import requests
import matplotlib.pyplot as plt
if not installed in your system install pandas and requests and matplotlib library library as
pip install pandas
pip install requests
pip install matplotlib
Now, we will find the URL that can communicate with Alpha Vantage. read API documentation to get the url you want. in this case we will use Daily adjusted time series data, and pull data for IBM stock.
So, Our url will look like
https://www.alphavantage.co/query?function=TIME_SERIES_DAILY&symbol=IBM&apikey=demo
remember to replace apikey = demo to your api key.
now, lets Implement using Python:
url = 'https://www.alphavantage.co/query?function=TIME_SERIES_DAILY&symbol=IBM&apikey=<API_KEY>'
r = requests.get(url)
When You run above code you will get the response of Success or failure.
print(f"Status Code {r.status_code}")
output:
Status Code 200
here “200” means API call is successful, now we move further.
Now, we will convert the data we received in json format and after convert it to pandas DataFrame.
data = r.json()
print(data)
df = pd.DataFrame(data['Time Series (Daily)']).T
df.head()
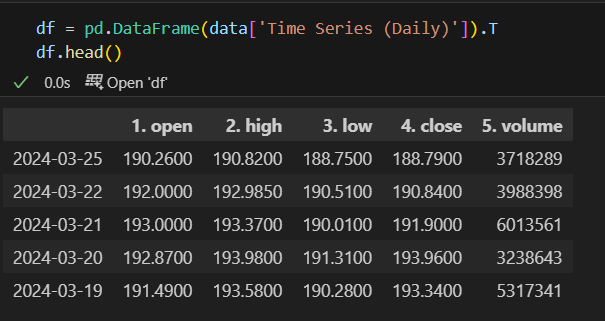
now, we have successfully fetch Daily Time Series Data and Stored in a dataframe, but Column name is not Suitable, So now change Column name,
df.rename(columns={"1. open": "Open",
'2. high':"High",
'3. low': "Low",
'4. close': "Close",
'5. volume':"Volume"}, inplace=True)
print(df.columns)
after renaming column name our column name will look like
Index(['Open', 'High', 'Low', 'Close', 'Volume'], dtype='object')

Latest posts by Datasciinsight (see all)
- How to Download Stock Data Using Interactive Brokers – 2024 - July 8, 2024
- Exploring the Best Python Libraries for Machine Learning – 2024 - April 20, 2024
- What is ElegantRL - April 11, 2024
Leave a Reply